
Chapter 8: Progress in achieving the global targets of the Sendai Framework
Introduction
The 2018 report of the United Nations Secretary-General on implementation of the Sendai Framework emphasized the vital importance of "a comprehensive overview of progress towards the seven global targets of the Sendai Framework and the disaster risk reduction targets of the Sustainable Development Goals" to guide discussions at the HLPF and Global Platform for DRR in 2019. The online SFM system is the official Member State reporting mechanism and is complemented by the preparation and release of technical guidance notes. The monitoring system provides an avenue for national reporting on:
- Seven Sendai Framework global targets based on the agreed 38 indicators
- Eleven indicators in three SDG goals, of which UNISDR is the custodian
Monitoring requires significant effort by Member States to collect, enter and validate all data required by the indicators that were agreed by the United Nations General Assembly and the United Nations Statistical Commission.
Using the data from the SFM system, including the disaster loss database complemented with data from other sources, this chapter focuses on a quantitative analysis of the progress made by countries towards the achievement of the global targets of the Sendai Framework (A-G). It does so through a detailed analysis of specific trends, patterns and distribution of selected indicators, based on available data from reporting to date in the online monitoring system. It also introduces the structure of the monitoring system, showcases results achieved and, where possible, data trends, while demonstrating the level of participation and engagement of Member States in the monitoring process.
8.1 Sendai Framework Monitoring database
The new online Sendai Framework Monitoring system is a state-of-the-art system built to support all the new indicators, extended hazards types and metadata mechanisms that were recommended by OEIWG and adopted by the United Nations General Assembly. It can be accessed at https://sendaimonitor.unisdr.org.
The related online tool for disaster loss and damage data collection, DesInventar Sendai, accessible at https://www.desinventar.net, was launched on 15 January 2018. The existing databases in the UNISDR public repository of loss and damage data were migrated to also support the requirements of OEIWG. This improved system will enable the collection of detailed disaster loss and damage data at all scales (temporal and spatial) using common methodologies. It also allows the capture of disaster information that is location- and time-stamped, contributing to a strong analysis of disaster loss and damage. Member States were invited to participate in monitoring and to start data-collection processes as soon as possible; the first milestone for data reporting that contributed to the SDG monitoring and reporting was set for 31 March 2018.
8.1.1 How the loss data subsystem contributes to data on the global targets
As of the time of writing of this GAR, data is available for 104 countries in DesInventar format. These databases contain detailed locally collected data on disaster losses, enabling a representative view of the way the impact of disasters affects countries. This initiative is an open data and open source initiative, making the information available for governments, affected communities and other stakeholders, including the private sector. Analysis presented in the following sections has been generated based on data from the SFM consolidated loss database.
8.1.2 Member State participation in the monitoring system in 2018
Ninety-six countries have started to use the Sendai Framework Monitoring system, out of which 79 are entering global targets data with different levels of progress on each target. Another 16 countries have started defining their institutional settings or entering the socioeconomic data required in the system such as population, GDP, exchange rate and other variables.
Figure 8.1. Progress on global targets, SFM (as of October 2018)
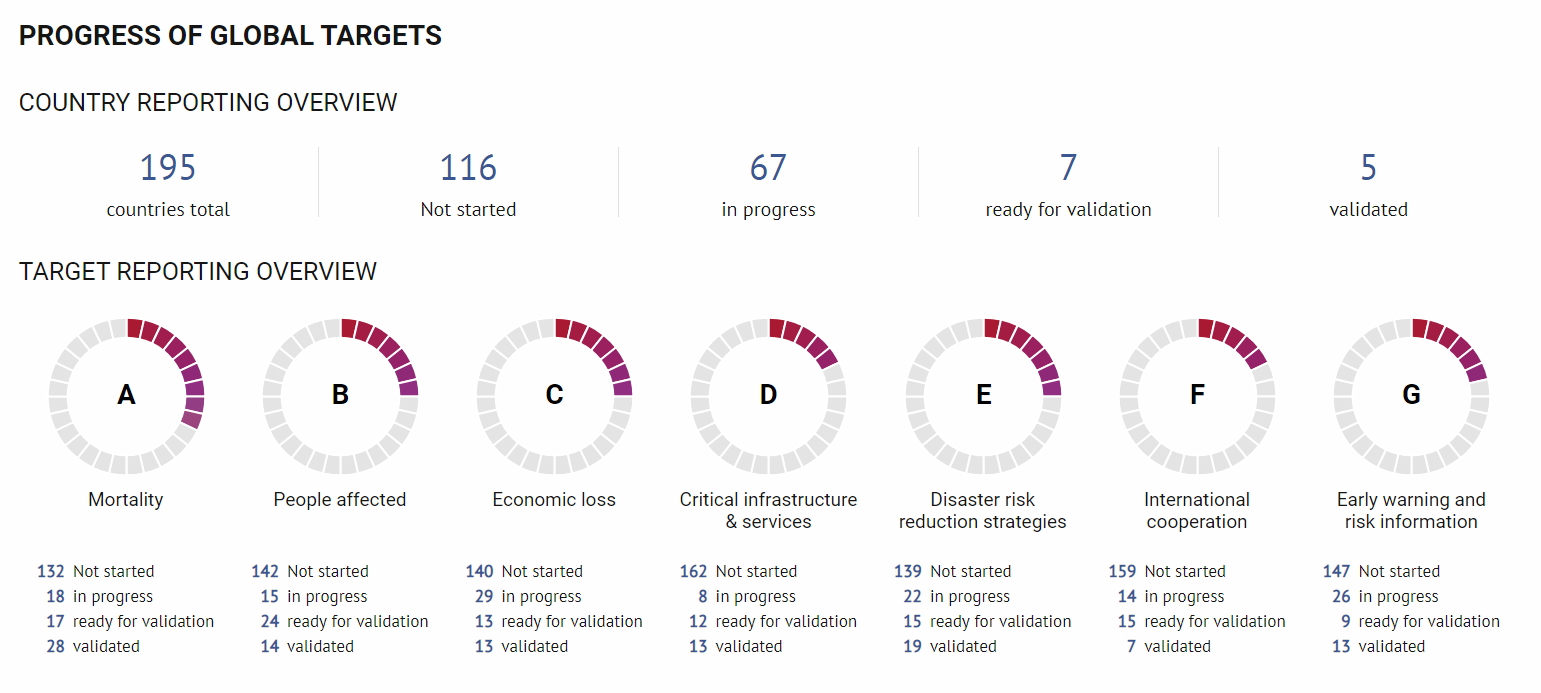
(Source: UNISDR, SFM)
Among those 79 countries that entered indicator data, by far the most commonly reported target is Target A, on mortality, for which 63 countries supplied data for at least one year. Target B was reported by 53 countries, Targets C and E by 56, Target D by 33, Target G by 48 and Target F by 36.
Within each target, there are also differences in reporting of the different indicators, which reflects the availability of data and collection challenges. The most evident of those is Target F (international cooperation), for which around half the countries reporting were unable to provide data on any of the eight indicators (19 out of 36).
8.1.3 New types of data that may come to the monitoring system in the future
As of July 2018, the Sendai Framework Monitoring system allowed Member States to set up nationally defined and customized targets and indicators, in addition to those already defined and built into the system for the Sendai Framework global targets. There are several important reasons a Member State may wish to do so. Measuring the level of implementation of the Sendai Framework global targets can capture only some aspects of progress in a country. But the Sendai Framework is a complex document that contains a broad set of suggested measures to reduce risk and losses. Countries will need to verify to what extent these recommendations and measures are applicable to their circumstances, and accordingly may want to measure their own level of implementation in a way that informs policy implementation. Furthermore, according to Target E, national DRR strategies should have national "targets, indicators and time frames", and custom indicators that are part of the Sendai Framework Monitoring system.
Member State efforts to define systems of custom targets and indicators are incipient, such that a detailed analysis is not possible. It is expected that, as part of the efforts to reach Target E, Member States will design a variety of custom targets and indicators in national DRR strategies, as suggested by Priority 2 of the Sendai Framework.
8.2 Disaster losses: Sendai Framework Targets A-D
8.2.1 Achievement of Targets A-D: are losses being reduced?
As the development of the reporting system for Member States required extensive expert inputs and consultations, the data collection and reporting period has been brief so far, and the number of countries providing data is too small to provide in-depth trend analysis. The following findings are therefore qualified, but make the best use of available data, including comparison with other data sources.
Two of the targets, mortality (A) and direct economic loss (C), were compared with global data sources. Analysis confirmed that progress found appears to be correct, as data series from all sources present the same trends - despite limitations in the scope and composition of the indicators available in global data sets. Most of the conclusions on the achievement of the first four targets are rather positive, especially when relative values are taken into consideration. As economies grow and the world population increases, more assets and people are exposed, which affects the interpretation of indicators such as the number of deaths or economic losses. Relative values allow inference of more accurate conclusions on the real impacts and magnitude of disasters over time for different people. For example, in absolute terms, richer households may lose more as they have more to lose. Although absolute figures are useful - they offer information on the trends and costs of disasters - they often fail to detail how disasters affect people's lives in the long run. Most important in disaster loss data analysis is the proportion of income or assets lost, as the severity of losses depends on who and how they experienced it.
8.2.2 Target A - mortality: a confirmed long-term decline in fatalities relative to population size
The first of the global targets refers to the reduction of mortality attributed to disasters. Mortality is decreasing in absolute and relative terms in the data gathered for the countries participating in the Sendai Framework Monitoring process, as well as in other global data sets.
Ultimately, Targets A and B, mortality and number of people affected by disasters, will require a comparison between the HFA years of 2005-2015 and the final decade of the Sendai Framework of 2020-2030. Only 35 countries have a complete set of data from 2005 to 2017. In 2016 and in 2017, 69 and 81 countries reported mortality data, respectively, but these countries are not the same as the group that has completed the HFA baseline. Therefore, the following preliminary analysis mostly focuses on the 83 countries that completed the HFA baseline and examines the period 2005-2015.
Numbers reported by countries in the Sendai Framework Monitoring system are higher than in EM-DAT by an average of 39%, and as much as 300% higher in some years, due to different methodologies applied to the data sets. The thresholds applied by EM-DAT on what constitutes a disaster (at least 10 people killed, 100 affected, declaration of a state of emergency and call for international assistance) mean that many small- and medium-scale disasters are not considered. This difference can be significant, especially for countries not exposed to large-scale hazardous events, or in years where large-scale disasters do not dominate the data.
8.2.3 Target B - people affected
A proxy for the number of people directly affected by disaster can be made through: (a) the number of people who require medical attention (injured or ill), (b) those who are living in dwellings damaged or destroyed by disasters and (c) those whose livelihoods are affected. While some double counting will occur (e.g. those injured and living in affected dwellings), the main objective of this proxy is to verify trends. Consequently, it aims to measure the achievement of the target on the basis that if these numbers grow, then the total number of people affected must be growing, and vice versa. If this proxy measure trends downwards, it would be safe to assume the total number of affected people was decreasing.
Application of these methodologies requires important data. Each indicator for the relative number of people affected by disasters in a country faces challenges, especially the determination of the number of those whose livelihoods were affected. Targets A and B of the Sendai Framework require dividing loss data by population, so that the numbers are relative to population and therefore more comparable with each other within a country, and among countries.
For this GAR, good data was available for the first five indicators of Target B: relative number affected in the population (B-1), ill or injured people (B-2) and damaged and/or destroyed dwellings (B-3, B-4 and B-5). However, for the livelihoods indicator (B-6), it was possible to estimate the number of workers associated with losses in agriculture only, not in other sectors. As more countries report in the monitoring system, including better reporting on productive assets lost (Indicators C-2 and C-3), these indicators will be able to account for more of the affected people.
8.2.4 Target C - direct economic loss: a long-standing decline in relative value as the world's gross domestic product increases
For a long time, statements such as "losses are growing exponentially" and "rising losses reached unprecedented levels" have dictated discussions of economic losses due to disaster. These estimates are useful for indicating the "stocktake" of average losses. Figure 8.16 demonstrates that overall losses and insured losses, adjusted to take into account inflation, significantly increased from 1980 to 2017. However, these figures fail to determine and provide finer detail on how disaster losses affect people's lives.
The Sendai Framework mandates a certain type of methodology for economic loss data by stating that Target C is to be the reduction of direct disaster economic loss in relation to global GDP by 2030. When figures of losses are divided by GDP, a different perspective on relative damage emerges, as shown later in this section.
Increases in the level of recorded loss in current data may occur because the monetary value of the exposed elements is higher and because more of these valuable assets are exposed. These factors should not be confused with higher risk. Individual assets have a specific level of risk, which is independent of the value of the asset, and is independent of the existence of other assets also being exposed. Dividing losses by GDP also reflects better the changing levels of risk.
8.2.5 Target D - damage to critical infrastructure and public services: an encouraging decline in recent years
The Asian Ministerial Conference on Disaster Risk Reduction (AMCDRR) in 2018 discussed the critical importance of the problem of infrastructure, highlighting that "half of the infrastructure needed in Asia by 2050 has yet to be built". In addition, the whole urban infrastructure should be treated as an interconnected and unique entity in terms of resilience, including the housing, industrial and commercial infrastructure that provides basic services to a growing population in urban areas. A holistic and multisectoral approach is needed when planning critical infrastructure. It should look beyond physical infrastructure and take into account the interdependent nature of services that urban infrastructure provides to society, including energy, water supply, transportation, telecommunications and other critical services.
8.2.6 Targets A-D: extensive risk analysis for the period 2005-2017: surprising facts of extensive risk in recent years
This section presents an update to the extensive risk analysis featured in previous GARs. Extensive risk is important for many reasons. However, the main one is that extensive risks are responsible for most damage to infrastructure and livelihoods, perhaps for most economic loss (as shown below) and represents an erosion of development assets such as houses, schools, health facilities, roads and local infrastructure. GAR efforts to reveal extensive risk aim at making the cost visible, as extensive risk losses tend to be underestimated and are usually absorbed by low-income households and communities.
For this GAR19, a focused analysis of extensive/intensive risk has been conducted. It is now limited to the period of the monitoring of the two frameworks - HFA (or the baseline) and the Sendai Framework - meaning the latest 12 years of data. In previous GARs, a longer period was researched, which may have introduced biases due to less data reporting in the initial years covered by the databases. While the period of the research is now shorter, the number of records analysed is high, with 320,000 disaster records, and includes a higher number of countries (104), which add to its strength as a statistical sample.
8.3 Target E: Progress on disaster risk reduction strategies for 2020
Two years before the deadline of Target E, there is no comprehensive picture of all strategies in place. The target speaks plainly about "national and local disaster risk reduction strategies", but the indicators that will measure this target are more difficult to quantify. Indicator E-1 requires national strategies to be "in line with the Sendai Framework", and local strategies to be "in line with National Strategies". It could be inferred therefore that local strategies should also be aligned with the Sendai Framework.
Some strategies are limited in scope and action, taking into consideration the specific context and capacity of the country. Therefore, DRR strategies are considered as a set of policy documents on relevant policy areas, from sectoral perspectives, or of targeted specific hazards. Measurement of compliance with the Sendai Framework should consequently be loosely interpreted.
The technical guidance notes proposed that the alignment of strategies with the Sendai Framework could be measured by a simple system of assigning scores, which, despite their subjectivity, could identify the alignment of a national strategy to the Sendai Framework. Box 8.2 shows the 10 criteria used for monitoring the progress of national DRR strategies where Member States conduct their own self-assessments. It should be underlined that attributed scores are for the alignment of national strategies to the Sendai Framework only, and do not offer any assessment on implementation of the strategy.
As with other targets and indicators, there are several data sources, which gives nuance to the conclusions to be drawn. In order of priority, these data sources are: the monitoring system, the UNISDR survey on implementation of the Sendai Framework, the Data Readiness Review and the results of the last rounds of reporting of HFA.
This section presents the results of the officially reported data available in the online Sendai Framework Monitoring system. By expanding on facts and figures from other data sources, it provides the best available overview of how Member States are progressing on DRR strategies.
8.4 Target F: Measuring international cooperation - too early for conclusions
In the Data Readiness Review study, Member States were asked to assess the availability and feasibility of providing data on the key indicators. This revealed that only 38% of Member States (33 out of 86 participating countries) would be capable of reporting on Indicator F-1: "Total official international support (official development assistance (ODA) plus other official flows), for national disaster risk reduction actions"; similar or lower numbers were reported for other indicators. For example, only 23% stated they would be able to report Indicator F-4: "Total official international support (ODA plus other official flows) for the transfer and exchange of disaster risk reduction-related technology". Participation in the first cycle of the monitoring exercise confirms this sparse availability of data. The average reporting rate for Indicator F-1, by far the best for Target F, reached only 25% of Member States. No analysis is provided for the rest of the indicators of Target F due to the low participation in monitoring.
The data available for tracking ODA and DRR expenditure and to fully account for these costs remains incomplete at a global scale. For instance, OECD reports that where such information exists, it is not gathered on a regular basis due to accounting and administrative fragmentation across sectors and levels of government collecting and processing such data. Macrolevel data on the global disaster risk financing gaps, and national and subnational data are necessary. To achieve this, improvements in reporting are required immediately. The renewed attention through the Sendai Framework provides an excellent opportunity for countries to report on national data and better understand the interplay between national and international sources in disaster risk financing. Providing a more comprehensive picture on where disaster aid and spending flows will help to build the evidence base for improved prevention, mitigation and preparedness funding. It is possible to start forming a global picture of financing for DRR using proxy indicators. In coming iterations of reporting for SFM, the availability of nationally reported figures will grow, and the use of proxies will complement increasingly granular data.
8.5 Target G: Multi-hazard early warning systems, and risk information and assessment - progress and challenges observed
Target G addresses the availability of, and access to, MHEWSs and disaster risk information and assessments. Indicators G-2 to G-4 are based on the four key elements of EWSs, informed by an international network on MHEWSs, namely: (a) disaster risk knowledge based on the systematic collection of data and disaster risk assessments (G-5); (b) detection, monitoring, analysis and forecasting of the hazards and possible consequences (G-2); (c) dissemination and communication, by an official source, of authoritative, timely, accurate and actionable warnings and associated information on likelihood and impact (G-3); and (d) preparedness at all levels to respond to the warnings received (G-4). Indicator G-1 is a compound indicator of the four indicators and stands for a fully fledged MHEWS with four key elements taking the values 0-1.
Reporting against Target G has been a challenge for Member States, although indicators were developed to take into account the global feasibility of reporting. Thirty-four Member States have reported at least one indicator for 2015-2018 (mostly related to Indicator G-3), while the smallest number reported on G-2 and G-5, which require a multi-hazard approach and specification of major hazards. Among the 34 reporting countries, 14 have reported a complete set of indicators from G-2 to G-5, which enables calculation of G-1. Despite a small number of reporting countries, the results reveal room for improvement on this target in most countries. Above all, reporting against G-5, with the lowest average among G-2 to G-5, demonstrates that most countries need comprehensive risk assessment for their defined major hazards.
8.6 Conclusions on the first reporting data for Sendai Framework Targets A-G
This GAR is informed by the latest disaster data available and infers early lessons on where the global disaster risk landscape currently stands. In terms of data infrastructure, there has been growing awareness since 2015 on the need for better and more comparable data, and SFM represents a unique opportunity to streamline interoperable data on disaster losses. While the observed period is still too short to reach definitive conclusions on a global scale, it is possible to observe certain patterns in terms of magnitude, geographic and socioeconomic distribution of disaster impacts and abstract several departure points of where and how countries have managed to do better in reducing disaster risk:
- In the broader picture, in terms of losses, there are severe inequalities of burden sharing between low- and high-income countries, with the lowest-income countries taking the highest toll and greatest costs of disasters. Asset and human losses tend to be higher in countries that have the least capacity to prepare, finance and respond, such as SIDS. However, the good news is that there has been an increase in the percentage of reporting containing economic loss data, for all income groups, particularly in the last four years, in contrast to former declining trends.
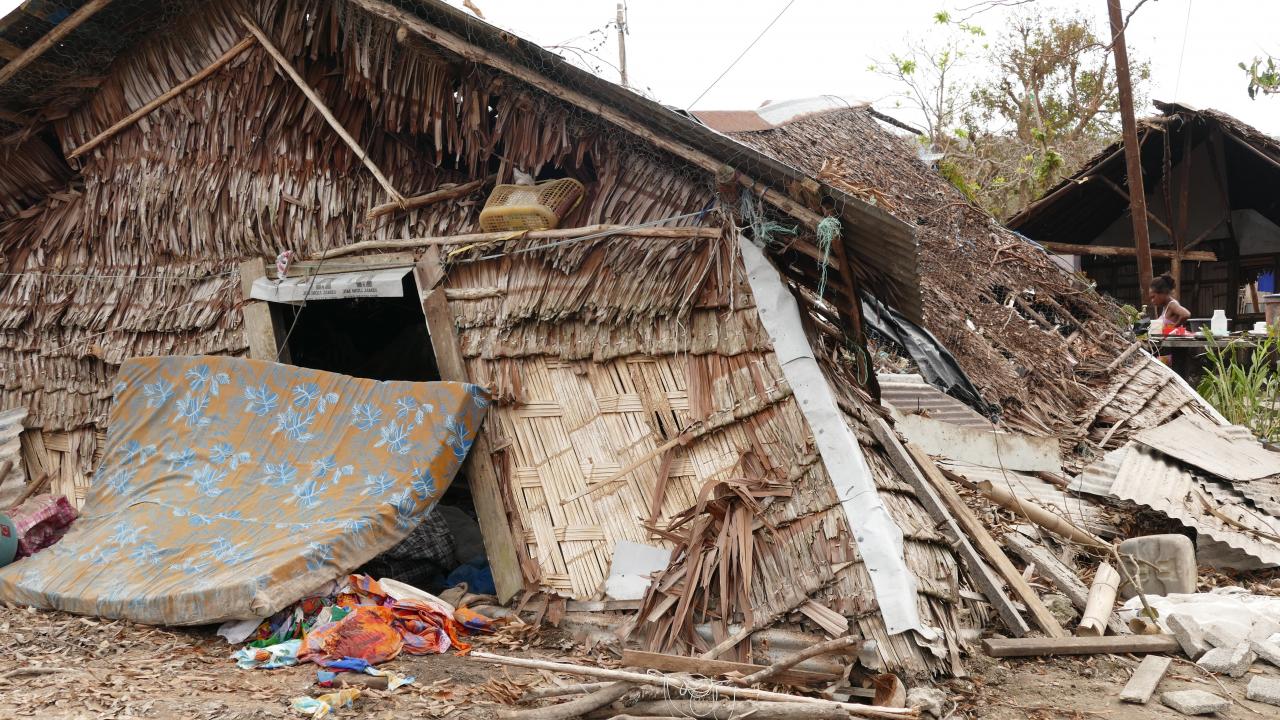
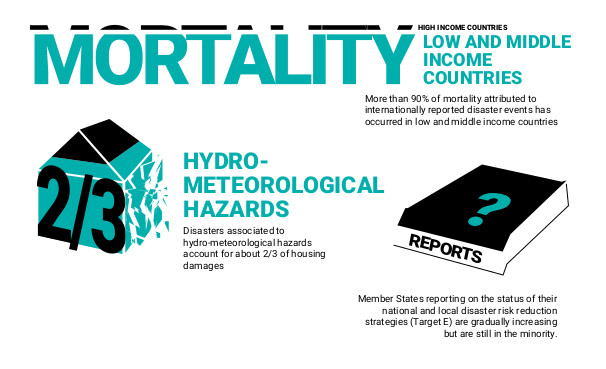
- Mortality relative to population size has declined in the long term. However, since 1990, 92% of mortality attributed to internationally reported disasters associated with natural hazards has occurred in low- and middle-income countries, persistently concentrated in the Asia-Pacific region and Africa.
- Geophysical hazard events (e.g. earthquakes and tsunamis) have taken the highest toll on human lives. Occurrences of reported disasters associated with biological hazards have decreased, while the number of disasters associated with natural hazards has slightly increased, over the past two decades. In terms of affected people, multi-hazard disasters affected 88 million people in SFM countries, followed by floods affecting 76 million people, in the period 1997-2017.
- Disasters stemming from natural hazards have displaced an average of 23.9 million people each year over the last decade, and 17.2 million in 2018 alone. Disasters - the main triggers of forced displacement recorded - show no signs of decreasing.
- Intensive risk continues to dominate fatalities, but the participation of extensive risk in mortality seems to be increasing. Most economic losses in the period 2005-2017 were caused by disasters associated with extensive risk, with 68.5% of all economic losses attributed to extensive risk events. With disasters becoming increasingly frequent, the cumulative damage, especially for people living in poverty, is often greater for extensive disasters such as droughts, than small- and medium-sized shocks that deliver low intensity but more frequent and recurrent shocks.
- In line with the analysis in previous GARs, extensive risks represent an ongoing erosion of development assets, such as houses, schools, health facilities, roads and local infrastructure. However, the cost of extensive risk continues to be underestimated, as it is usually absorbed by low-income households and communities.
- Weather-related hazards take the lead in economic losses, with floods being the costliest hazard, followed by earthquakes. Meanwhile, losses in the housing sector account for two thirds of total economic losses.
- Losses in agriculture, the second most-affected sector, are again significantly higher and more persistent in low- and low-middle-income countries, with increasing frequency and severity of floods, droughts and tropical storms. The relationship between drought and agriculture deserves special attention, as 84% of the damage and losses caused by droughts resides therein. Beyond the obvious production losses, disasters have a significant impact on rural livelihoods, food value chains, trade flows of agricultural commodities, and food and non-food agro-industries. Initiatives to support diversification of livelihood opportunities, farm and non-farm activities, and more sustainable (self-) employment are critical. Expanding financial inclusion, providing social protection and adaptive safety nets, contingent finance and forging ownership by supporting rural communities to invest their savings into economic ventures of choice can place households in a better position to cope with disasters and build back better.
- Financing for DRR has been highly volatile, ex post and marginal. A total of $5.2 billion for DRR represents 3.8% of spending between 2005 and 2017 - less than $4 for every $100 spent - a marginal fraction of the total amount. Global funding requirements are increasing, while the national and international capacity to address them is not growing in proportionate terms, leaving millions of affected populations behind.
- Member States reporting on the status of their national and local DRR strategies are gradually increasing, yet improvements for a full coverage on a global scale are to be made, one year ahead of the deadline.
- Economic losses from disasters totalled $75 billion in 2017 (UNISDR data), and over $300 billion from other sources (Munich Re and Swiss Re). The $75 billion estimate of the average annual losses deviates substantially from other observations, as data is imperfect and disasters remain significantly non-/underreported, compromising accurate calculations of the true impacts of disasters. Eleven years ahead of the 2030 deadline, a sense of urgency should be injected into improving reporting across indicators and targets, enabling the engineering of evidence-based solutions for disaster-affected populations.
- While useful for illustrating the stocktake of average losses, average estimates often fail to provide finer details on how disasters affect people's lives. In absolute terms, high-income households lose more because they have more to lose, and those losses are more visible because they tend to be insured and better reported. Previous GARs have repeatedly argued that what matters most in disaster loss analysis is the proportion of income or assets lost, as the severity of losses depends on households and how they experience disasters.
- This GAR argues that as data-collection efforts across different global frameworks are embarked upon, it is necessary to look at indicators afresh across goals and targets. It is also necessary to establish metrics for those dimensions of disaster impacts that accrue to the most vulnerable by delving deeper into distributional analysis, moving away from regional, national and subnational data to the household level. The goal is to first learn in finer detail how disasters affect people's lives in a systemic way and then support countries to engineer solutions and influence human behaviour to successfully rebound from disasters.